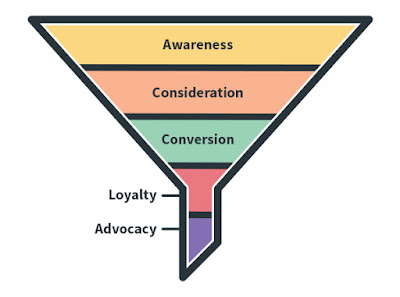
With Purchases as your end goal, it's important to remember the stages along the process that lead people to become customers. This is often visualized as a funnel because you will gradually narrow your focus as you connect with the most engaged people. Online marketing can address all of the steps from Awareness to Purchase, but some channels are better for one versus the other, and as such, the metrics you should pay attention to will differ.
 |
| Image from AWeber Email Marketing |
To start there are a couple key concepts that apply to all channels (although they may have different labels). Reach is how many people you're getting in front of to spread Awareness, while Impressions is a total count of these views. Clicks demonstrate the activity taken whether that's an engagement on Social Media or intent to visit a link. Traffic is how many people are visiting to consider your offerings. Leads are people that have shown interest in buying and are well on their way to becoming Customers. If you see Unique in front of any of these terms that means an unduplicated count so each person is only tallied once even if they take an action twice. And now, how do these translate to across all of the platforms you may be using online?
WEBSITE
- Traffic or Visits - Number of people coming to your site.
- Traffic Sources - How people are getting to your site.
- Direct, Social, Referral, Email, Blog
- Bounce Rate - % of visitors that only view one page.
- Time on Site - How long people peruse during their visit.
- Pages Visited - Average number of pages per visit.
- Pageviews - Count of total pages visited by audience.
- Conversions - Form submissions, Contacts, Purchases, etc.
 |
| Sample of Google Analytics |
SOCIAL MEDIA
- Impressions - How many times your posts are being seen.
- Reach - How many unique people are seeing your posts.
- Engagement - Interactions with what you're sharing.
- Likes, Comments & Shares (or Reposts / Retweets)
- Clicks - Traffic to links you've shared to outside sources.
 |
| Sample from Facebook Page Insights |
EMAIL MARKETING
- Subscribers - Number of email addresses on your list.
- Open Rate - How many times your blast was opened.
- Clicks - Count of people visiting any links you shared.
- Unsubscribes - People who opt out of receiving emails.
 |
| Sample from MailChimp Email Platform |
ONLINE STORE
- Traffic or Visits - Number of people coming to your site.
- Listing Views - How many times each listing is visited.
- Traffic Sources - How people are getting to each listing.
- Add to Cart - Demonstration of intent to purchase.
- Purchases - Count of buyer conversions on your site.
- Average Order Value - Average total revenue per order.
- Conversion Rate - % of visitors who end up buying.
- Cart Abandons - Number who leave before purchasing.
- Repeat Purchase - Returning customers who buy again.
 |
| Sample of Etsy Store Stats |
Hopefully these examples help you dive deeper in the to metrics available for gauging your success. Each platform will have its own reporting, but main measurements should be the same. If you need help interpreting what you're seeing, feel free to reach out. I'd be happy to talk through the data or get you started with the best tools to get measuring.